“Waveform capnography is the gold standard and should be used routinely for detecting correct tracheal intubation”
Capnography results can be displayed in two ways: a capnometre, which reports numeric values, or a capnograph, which displays results as a waveform. Waveform capnography is the continuous measurement and graphical display of the concentration or partial pressure of carbon dioxide (CO₂) in a patient’s exhaled breath over time.
The monitor displays a capnogram, a waveform that provides real-time information about:
Capnographs are currently considered the optimal method of reading capnography because they provide continuous monitoring [2] rather than delivering results at regular intervals like capnometres meaning that there is access to real-time data on the status of patients’ breathing.
Waveform capnography is used in both pre-hospital and hospital settings, although it is most commonly seen during and after sedation or anaesthesia. By continuously displaying exhaled CO₂ as a waveform, it helps clinicians monitor ventilation, cardiac output and respiratory status in real time. To find out more, read our article on EtCO₂.
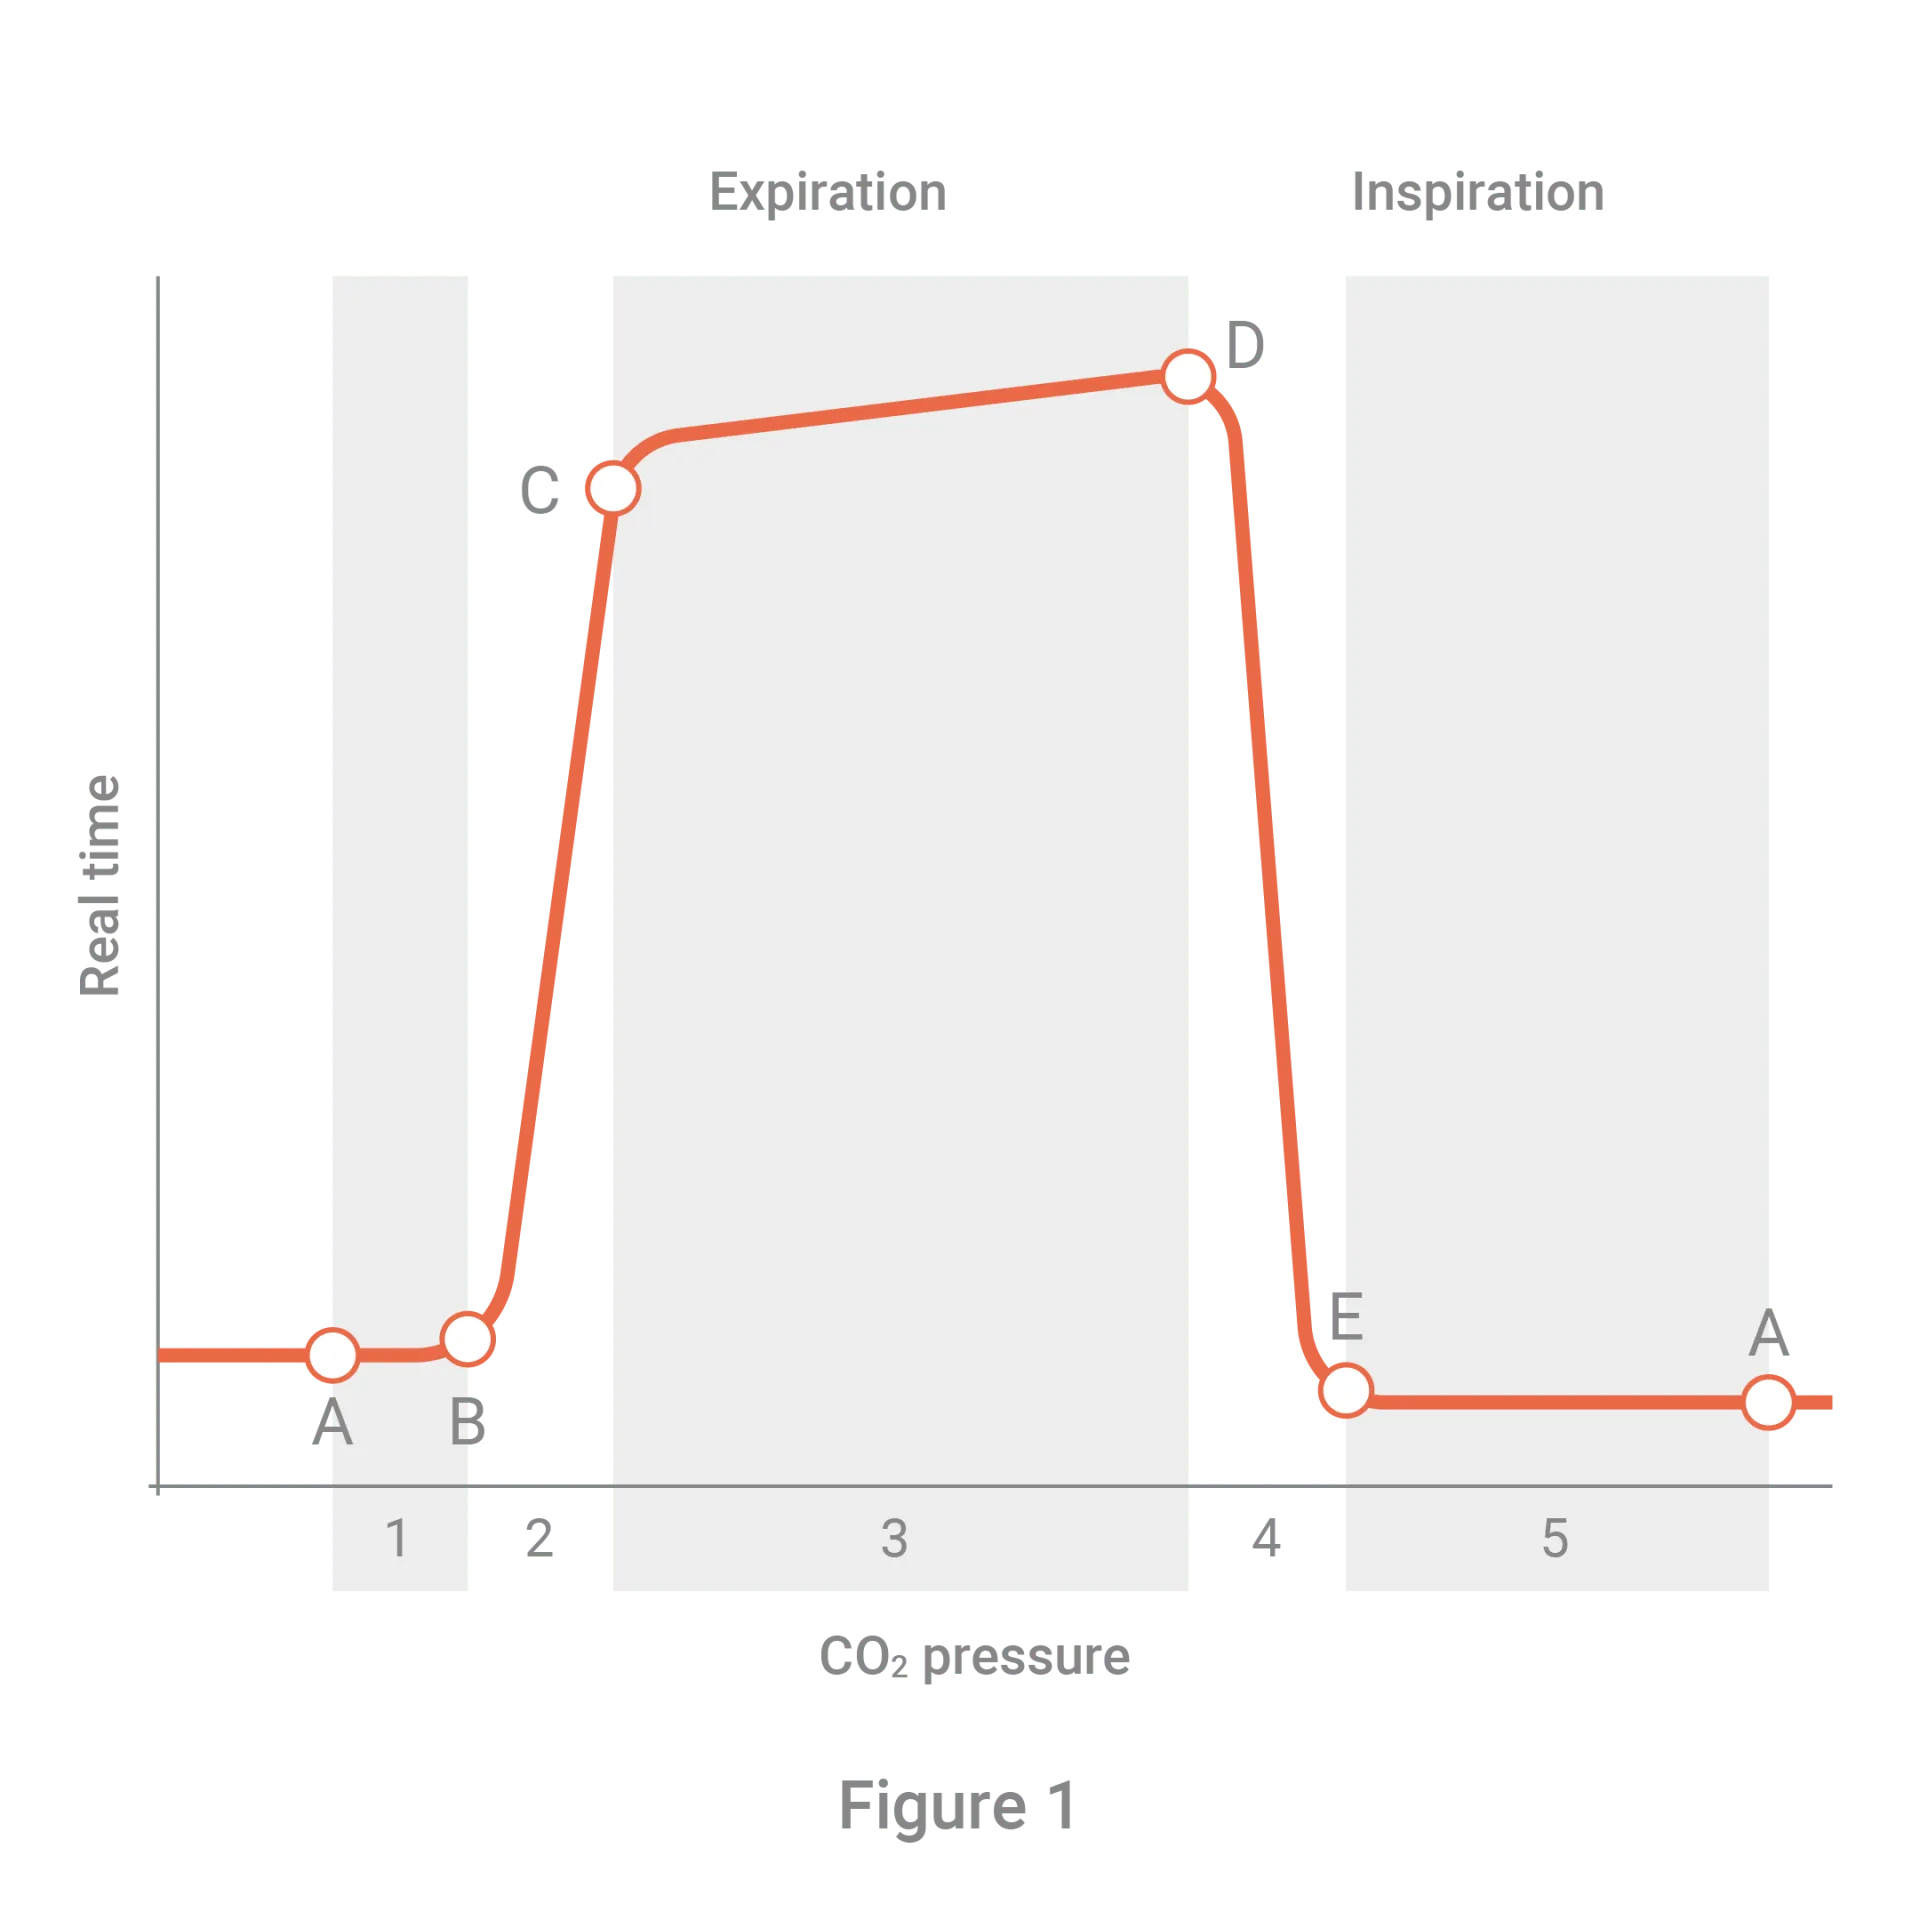
A normal, healthy capnograph can be described as reminiscent of a top hat. The left side shows how quickly and easily the air is moving into the lungs, and the right side shows how quickly and easily it is leaving the lungs, whilst the top line shows how easily the alveoli are emptying.
When it comes to measuring results, standard ventilation rates differ depending on age but always remain the same for men and women with the same age bracket. Adults should have 10-12 breaths per minute (bpm), children should have 15-30, and infants should have 25-50.
Ideally, waves should reach between 34-45 mmHg.
This phase occurs during respiration and is also known as the baseline. There is no CO₂ as O₂ is the first gas to pass the sensor; therefore, CO₂ is very low or non-existent. With no gas exchange, this is also known as dead space.
This phase is also referred to as the ascending or early expiration form. Here, CO₂ rises with an apparent delay. CO₂ rich gas from the lung’s alveolar reaches the upper airways and mixes with the dead air space (referenced in Phase I). This causes a rapid increase in CO₂ levels, detected by the capnograph in exhaled air.
This occurs during late expiration. It involves the continuous movement of CO₂ across the sensor, causing the straight line captured in the capnograph (the alveolar plateau).
This phase starts at the end of the alveolar plateau when the last air leaves the alveoli. It is where the EtCO₂ is measured during the respiratory cycle. This phase also shows the beginning of O₂ inspiration and the drop to zero CO₂ levels.
Essentially, capnographs show the length and CO₂ pressure of a person breathing. When the graph goes up, they are breathing in, and when it goes back down, they are breathing out.
The X-axis of the table measures the length of time the breath lasted in seconds, whilst the Y-axis reflects the amount of CO₂ exhaled, which is measured in units of pressure (mmHg).
This means that the longer a breath lasts, the longer the wave will be therefore, slow breathing will produce longer waves whilst fast breathing has shorter waves. Conversely, the higher the pressure of CO₂ in the breath, the higher the wave will go, with low pressure producing lower waves along the Y-axis.
Waveform capnography provides the real-time respiratory status updates
The age of the patient affects the average bpm expected
A healthy wave will look like a top hat
The higher the wave, the more CO₂ present
The longer the wave, the slower the breathing
Correctly interpreting capnographs is important as it can reveal the source of respiratory issues simply from the appearance of the wave.
Incomplete inhalation or exhalation is often caused by air getting trapped, and this can be due to asthma or Chronic Obstructive Pulmonary Disease (COPD) conditions, including emphysema. It can be discovered on capnographs if the bottom line of the graph gradually reaches a higher pressure, without ascending back down to zero each time.
The loss of the alveolar plateau means that the alveoli could not be entirely emptied, indicating problems such as bronchoconstriction and asthma. On capnographs, this issue presents as the loss of the straight top line, which results in a gradual increase followed by a sharp decrease. This often looks like a shark fin.
Apnea is the cessation of breathing. It is often caused by respiratory arrest, or in intubated patients, a breathing tube may be dislodged and needs to be corrected. Apnea presents as a flat line on the graph, with no CO₂ present nor any oxygen being taken up.
Hypoventilation occurs when the levels of CO₂ gradually increase. This indicates that there is too much CO₂ in the blood, and therefore the body is not getting enough oxygen, which COPD and heavy sedation can cause. Hypoventilation is signalled on the graph by the top line getting higher with each breath as CO₂ levels increase.
Hyperventilation is when the patients’ breathing is deeper than usual or more rapid. This condition is often caused by panic attacks or Pulmonary Embolism. The capnograph for this issue would start slowing but at a normal rate. Over time, the waveform would narrow, and EtCO₂ levels would decrease. The smaller waveforms represent the rapidness of the breaths.
Mediplus has a solution for you.
Capnomask™ is a medium concentration mask for EtCO₂ monitoring. It was designed alongside clinicians to enable accurate detection of EtCO₂ and enhance patient safety.
The high performance Capnomask™ is impregnated with a subtle vanilla scent to help reduce post-operative nausea and vomiting.

 Anaesthesia
 Gynaecology
 Operating Room
 Urology